

Most AI video creation trends come from surveys, where marketers report what they think they do. Pictory is an AI video platform, so we have the other kind of data: what 1.5 million videos looked like when people actually made them in 2026. US creators are 22% of that set. Their habits vary more by state than we expected, and the day of the week turned out to matter too.
TL;DR
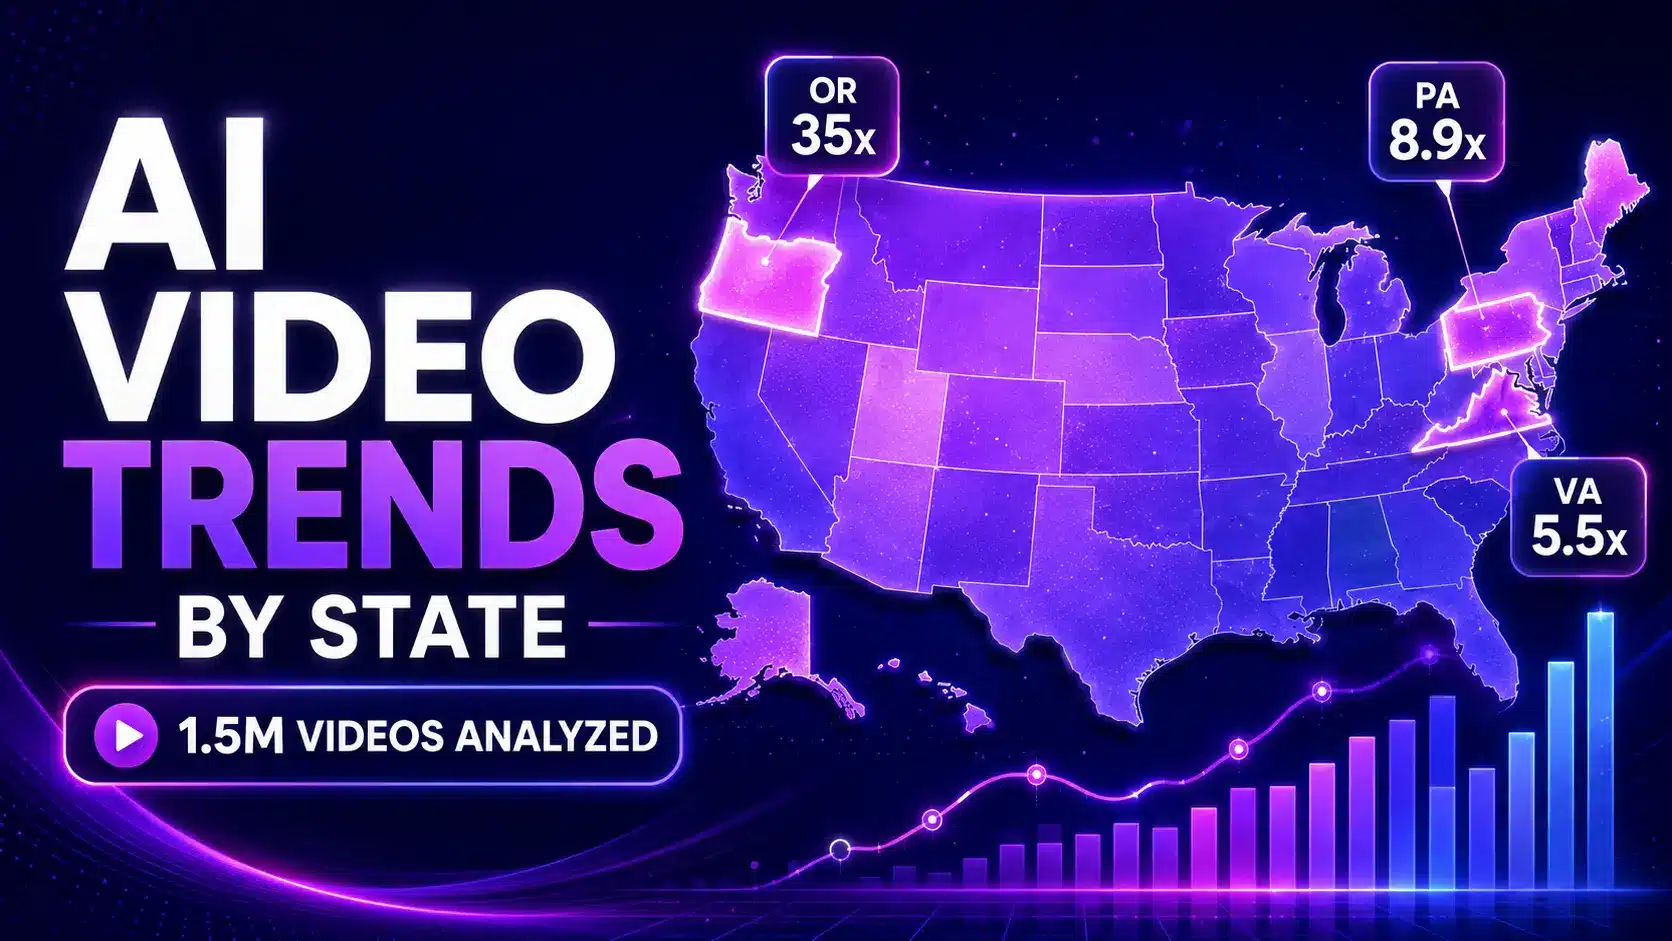
We analyzed 1.5 million videos created in Pictory during 2026 and pulled the US data out. Virginia creators make the most videos per person. Oregon generates AI images at 35x the national rate. Pennsylvania leads on voiceovers and avatars. And Monday is the peak production day in 12 of the 15 largest states. Most of these gaps are wide enough to act on.
What did 1.5 million videos reveal about AI video creation in America?
US creators don’t behave like one market. Feature use swings by more than 35x between states. Virginia leads on volume per person, Oregon on AI images, Pennsylvania on voiceovers and avatars, and Minnesota on length. State population predicts almost none of it.
The headline numbers, all drawn from the full 2026 State of Video Report:
- Virginia creators generate videos at 5.5x the US average per user
- Oregon creators generate AI images at 35x the US average per user
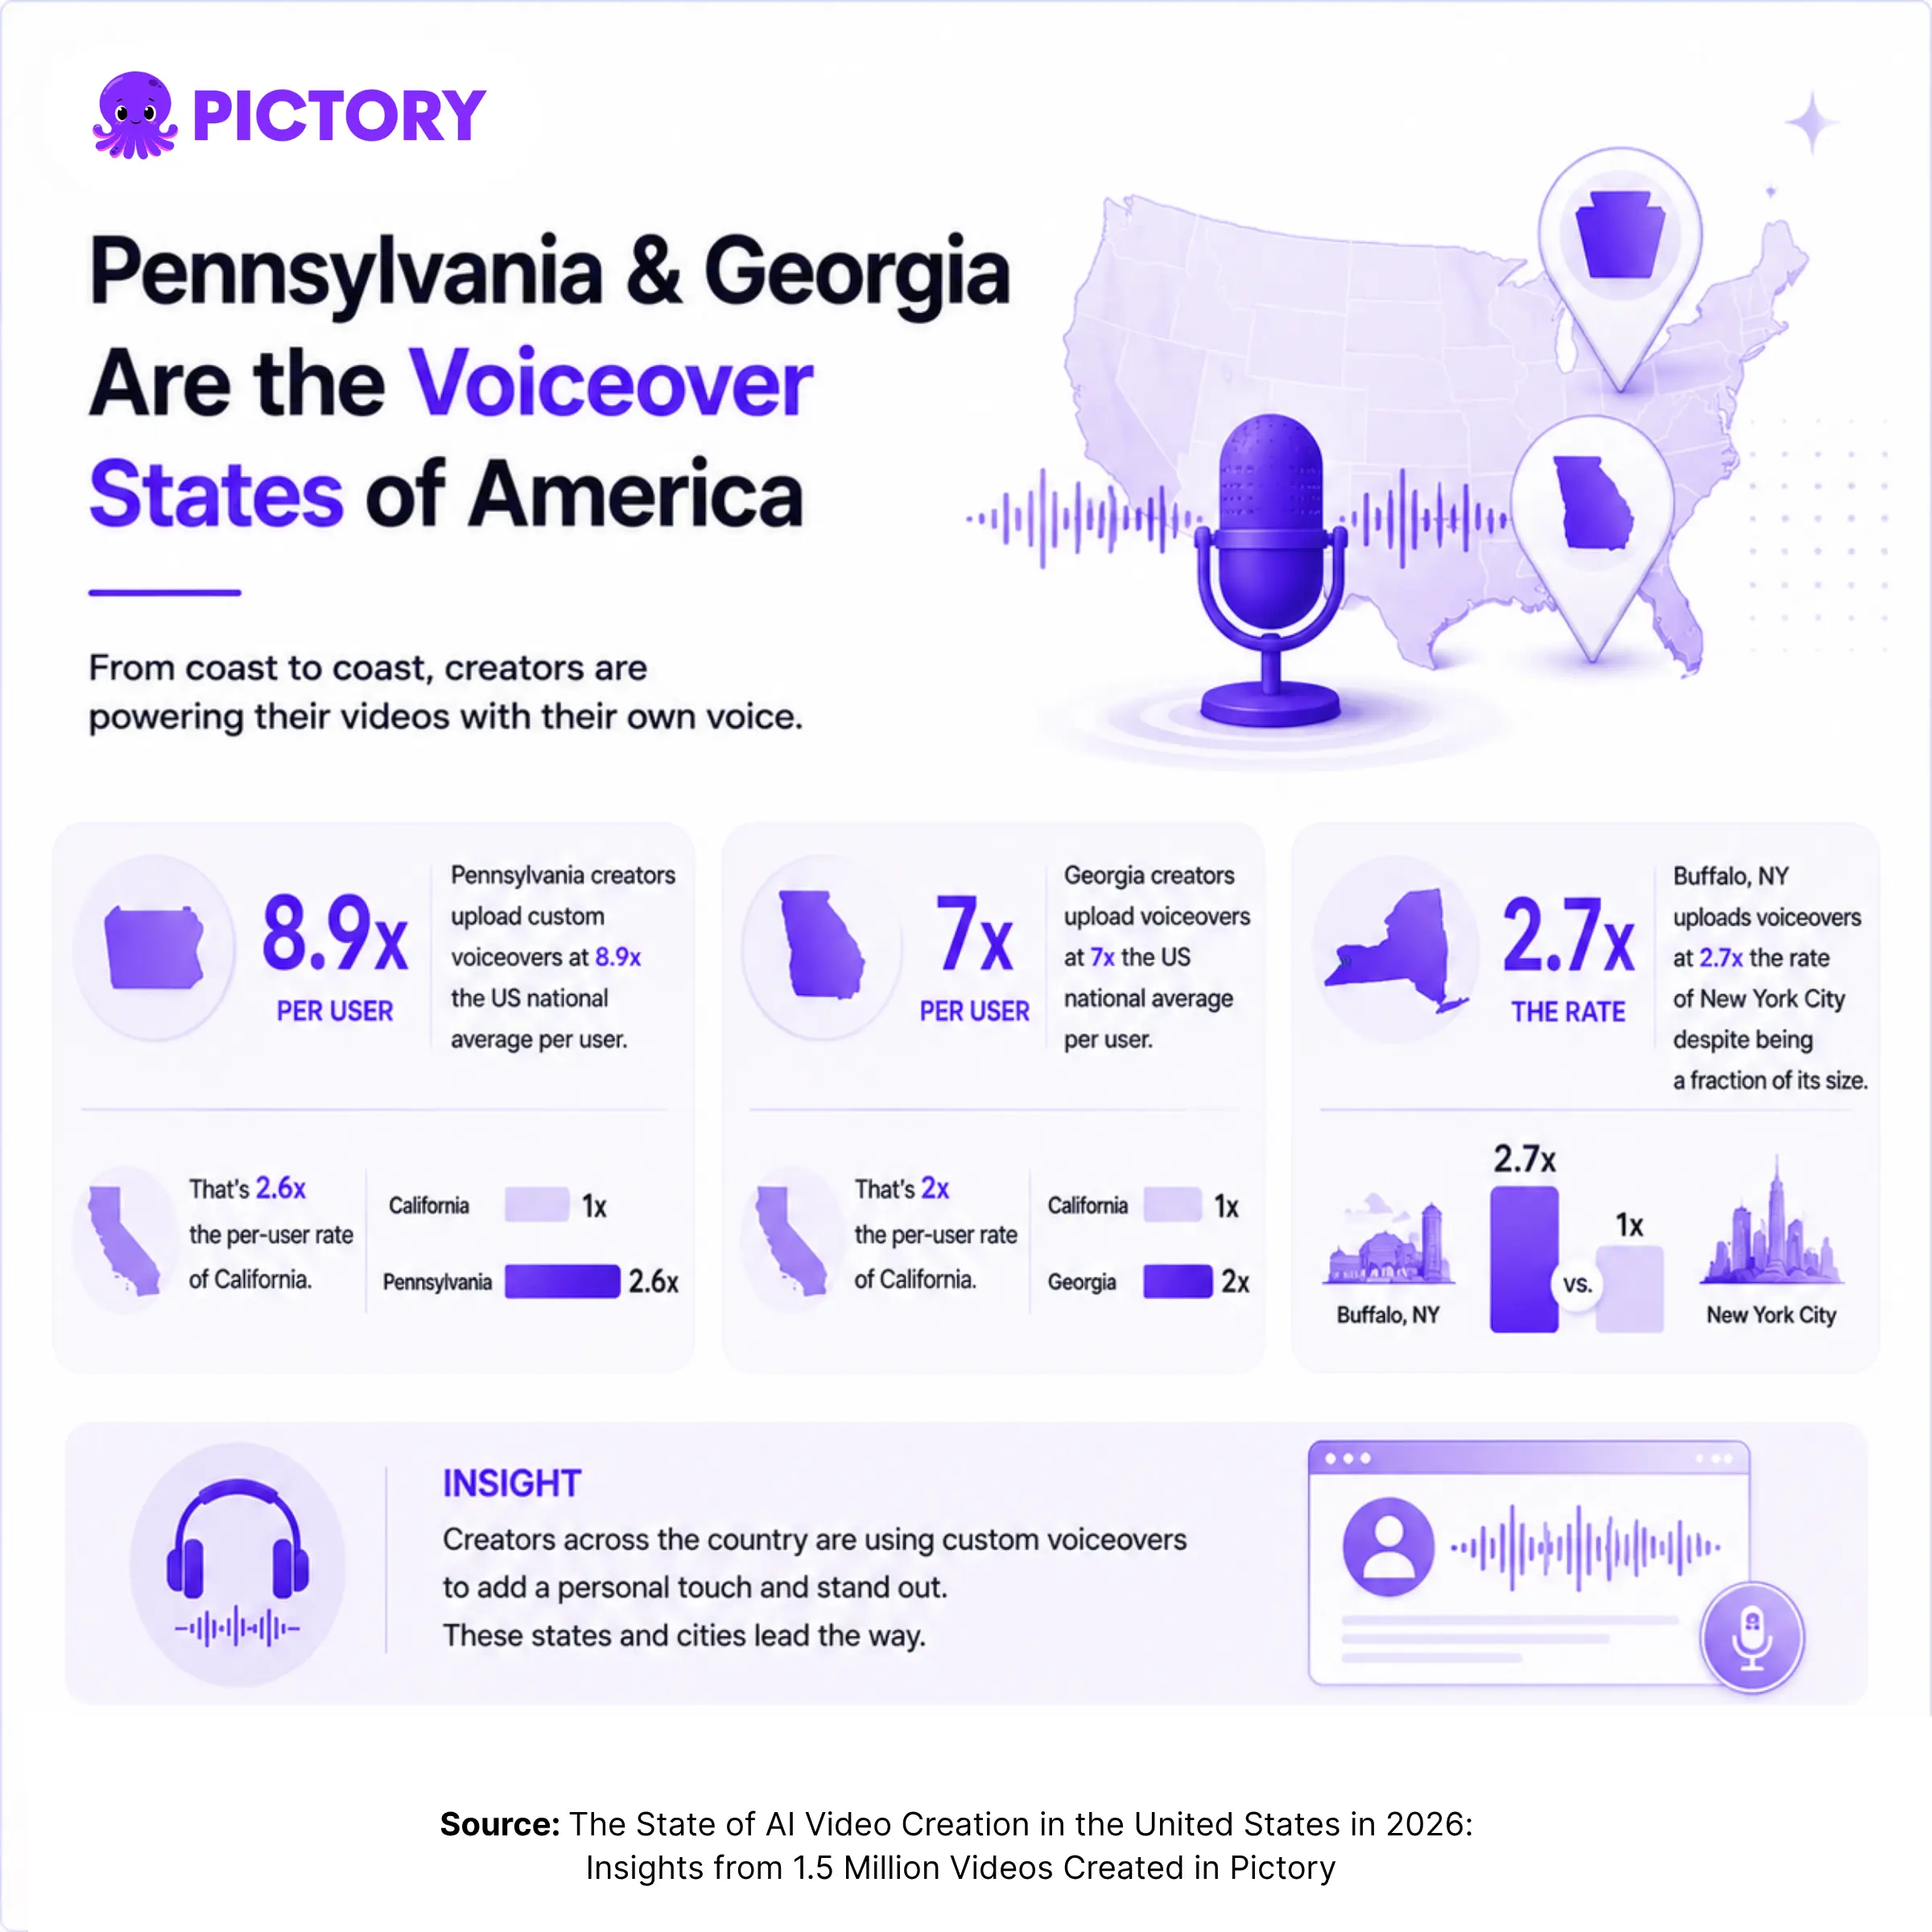
- Pennsylvania creators upload voiceovers at 8.9x the US average per user
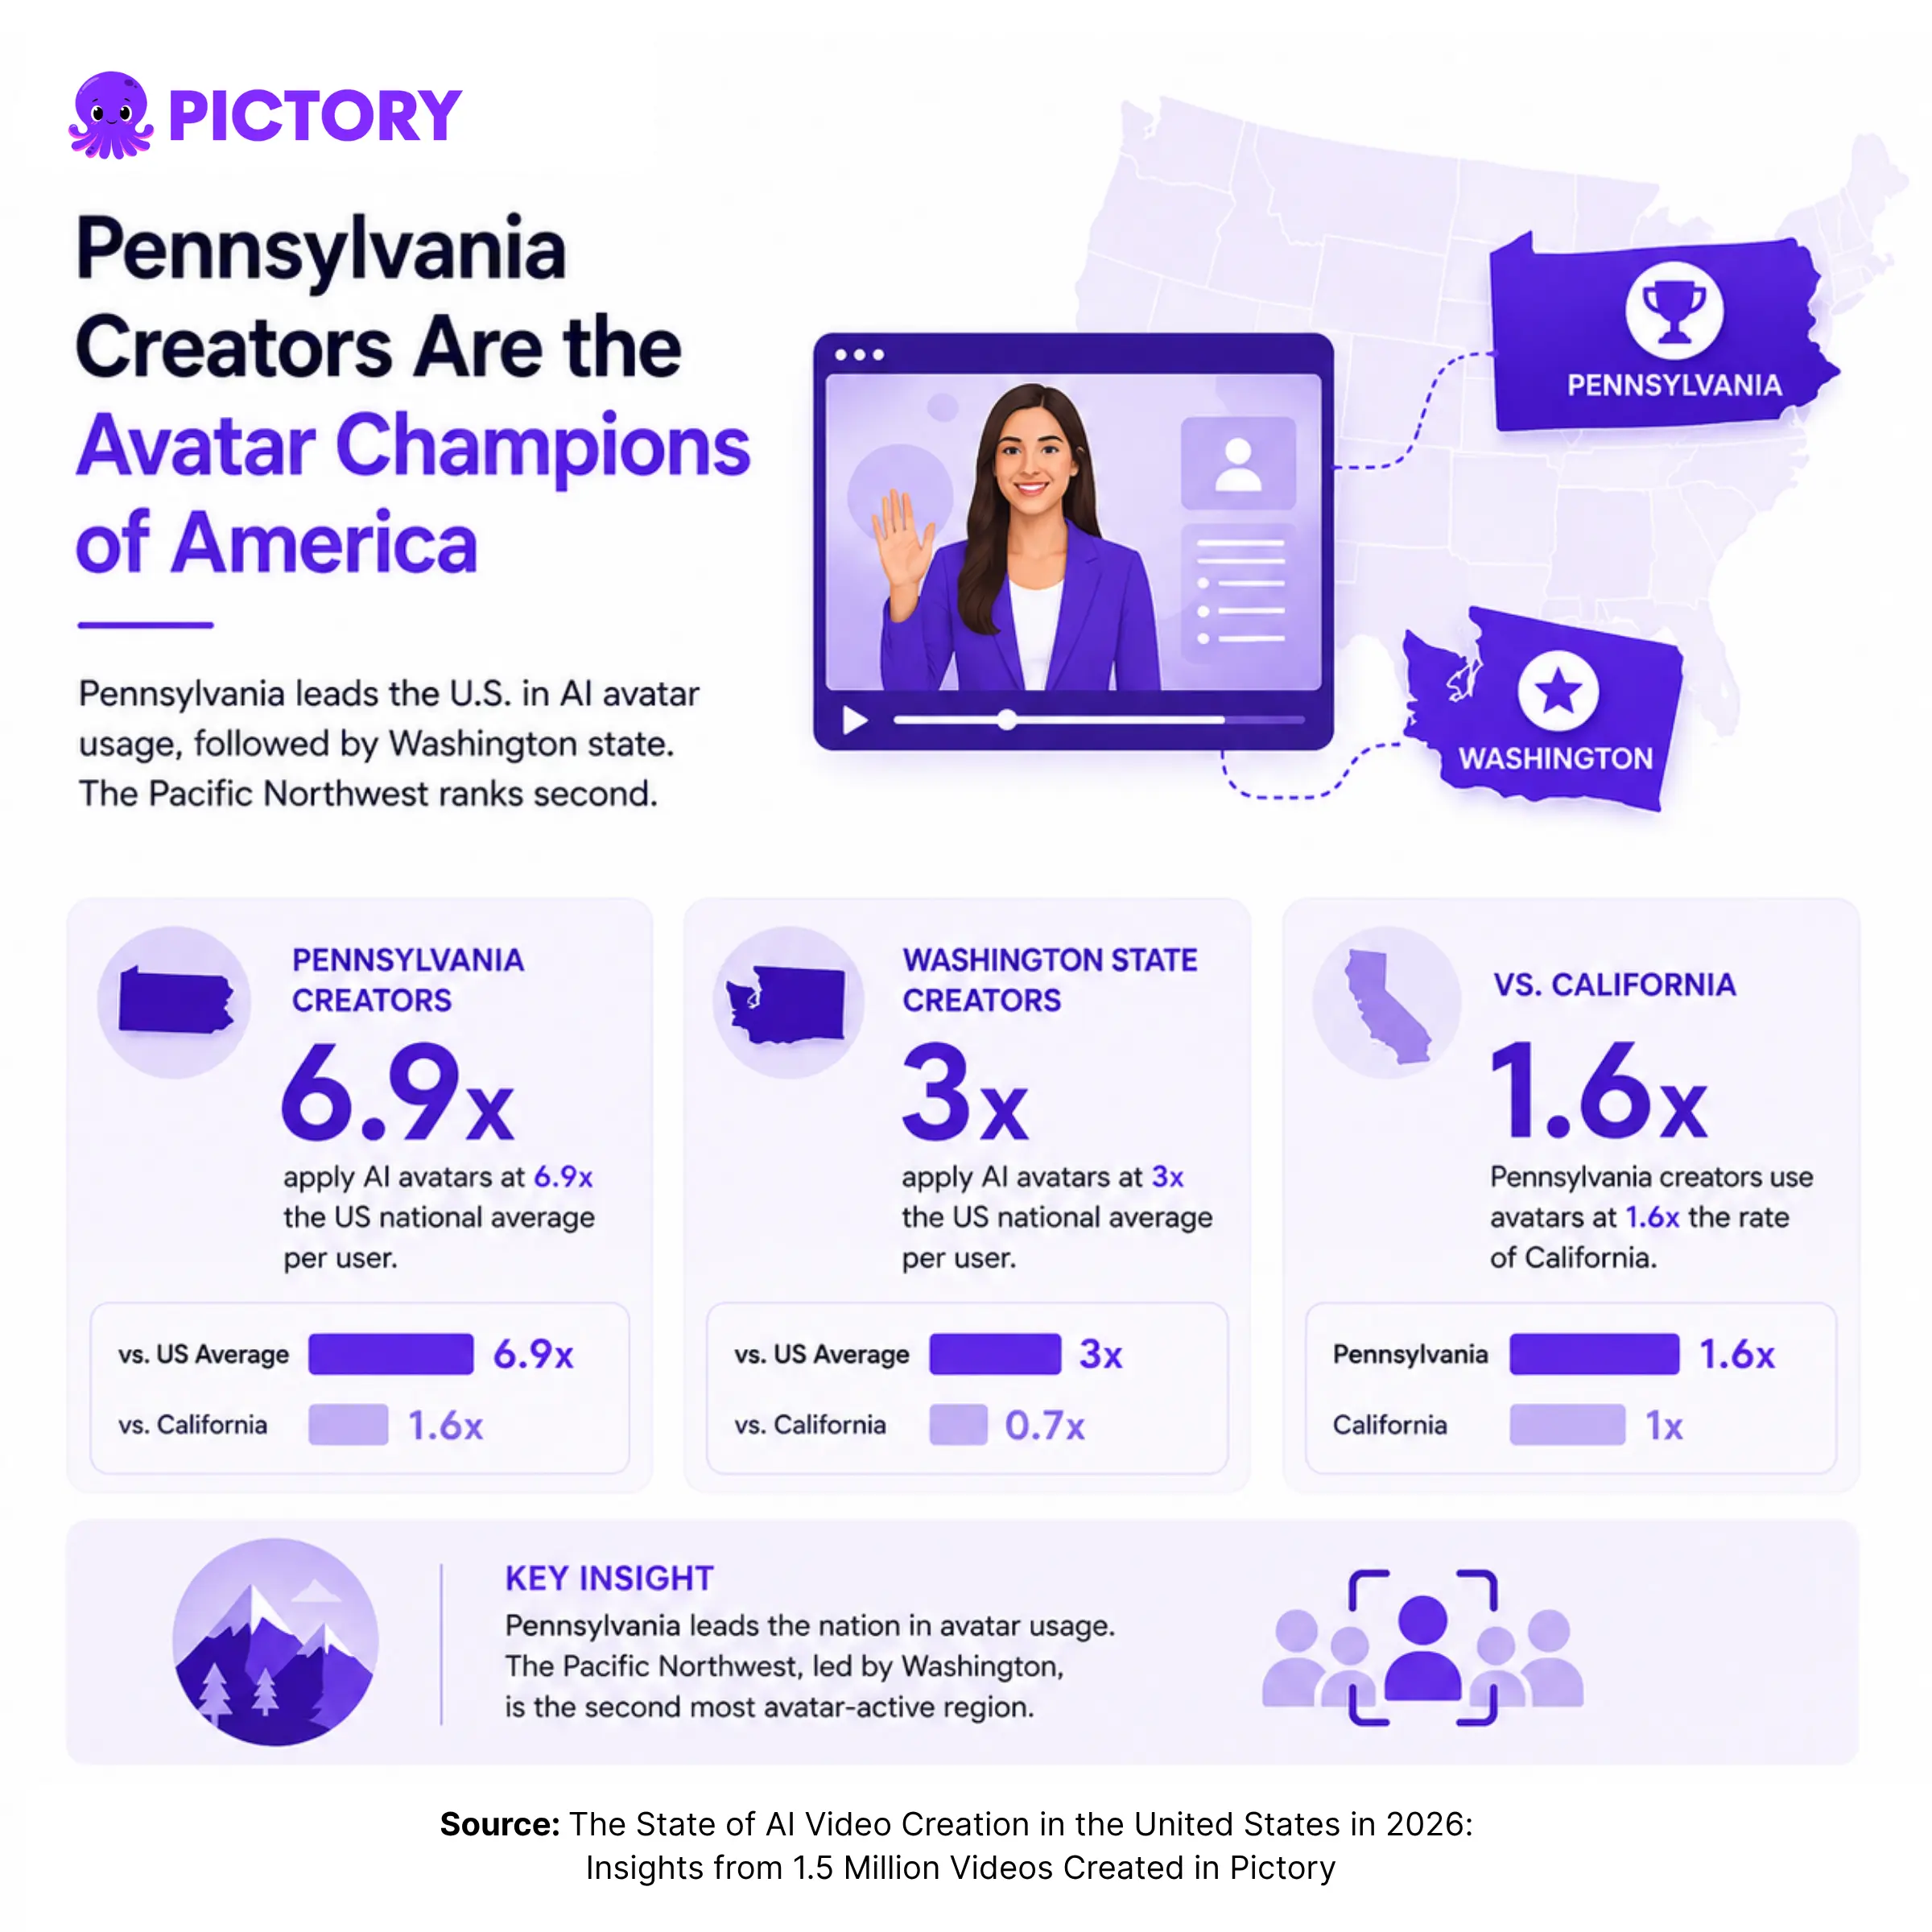
- Pennsylvania creators apply AI avatars at 6.9x the US average per user
- Minnesota videos run 2.2x longer than the national average
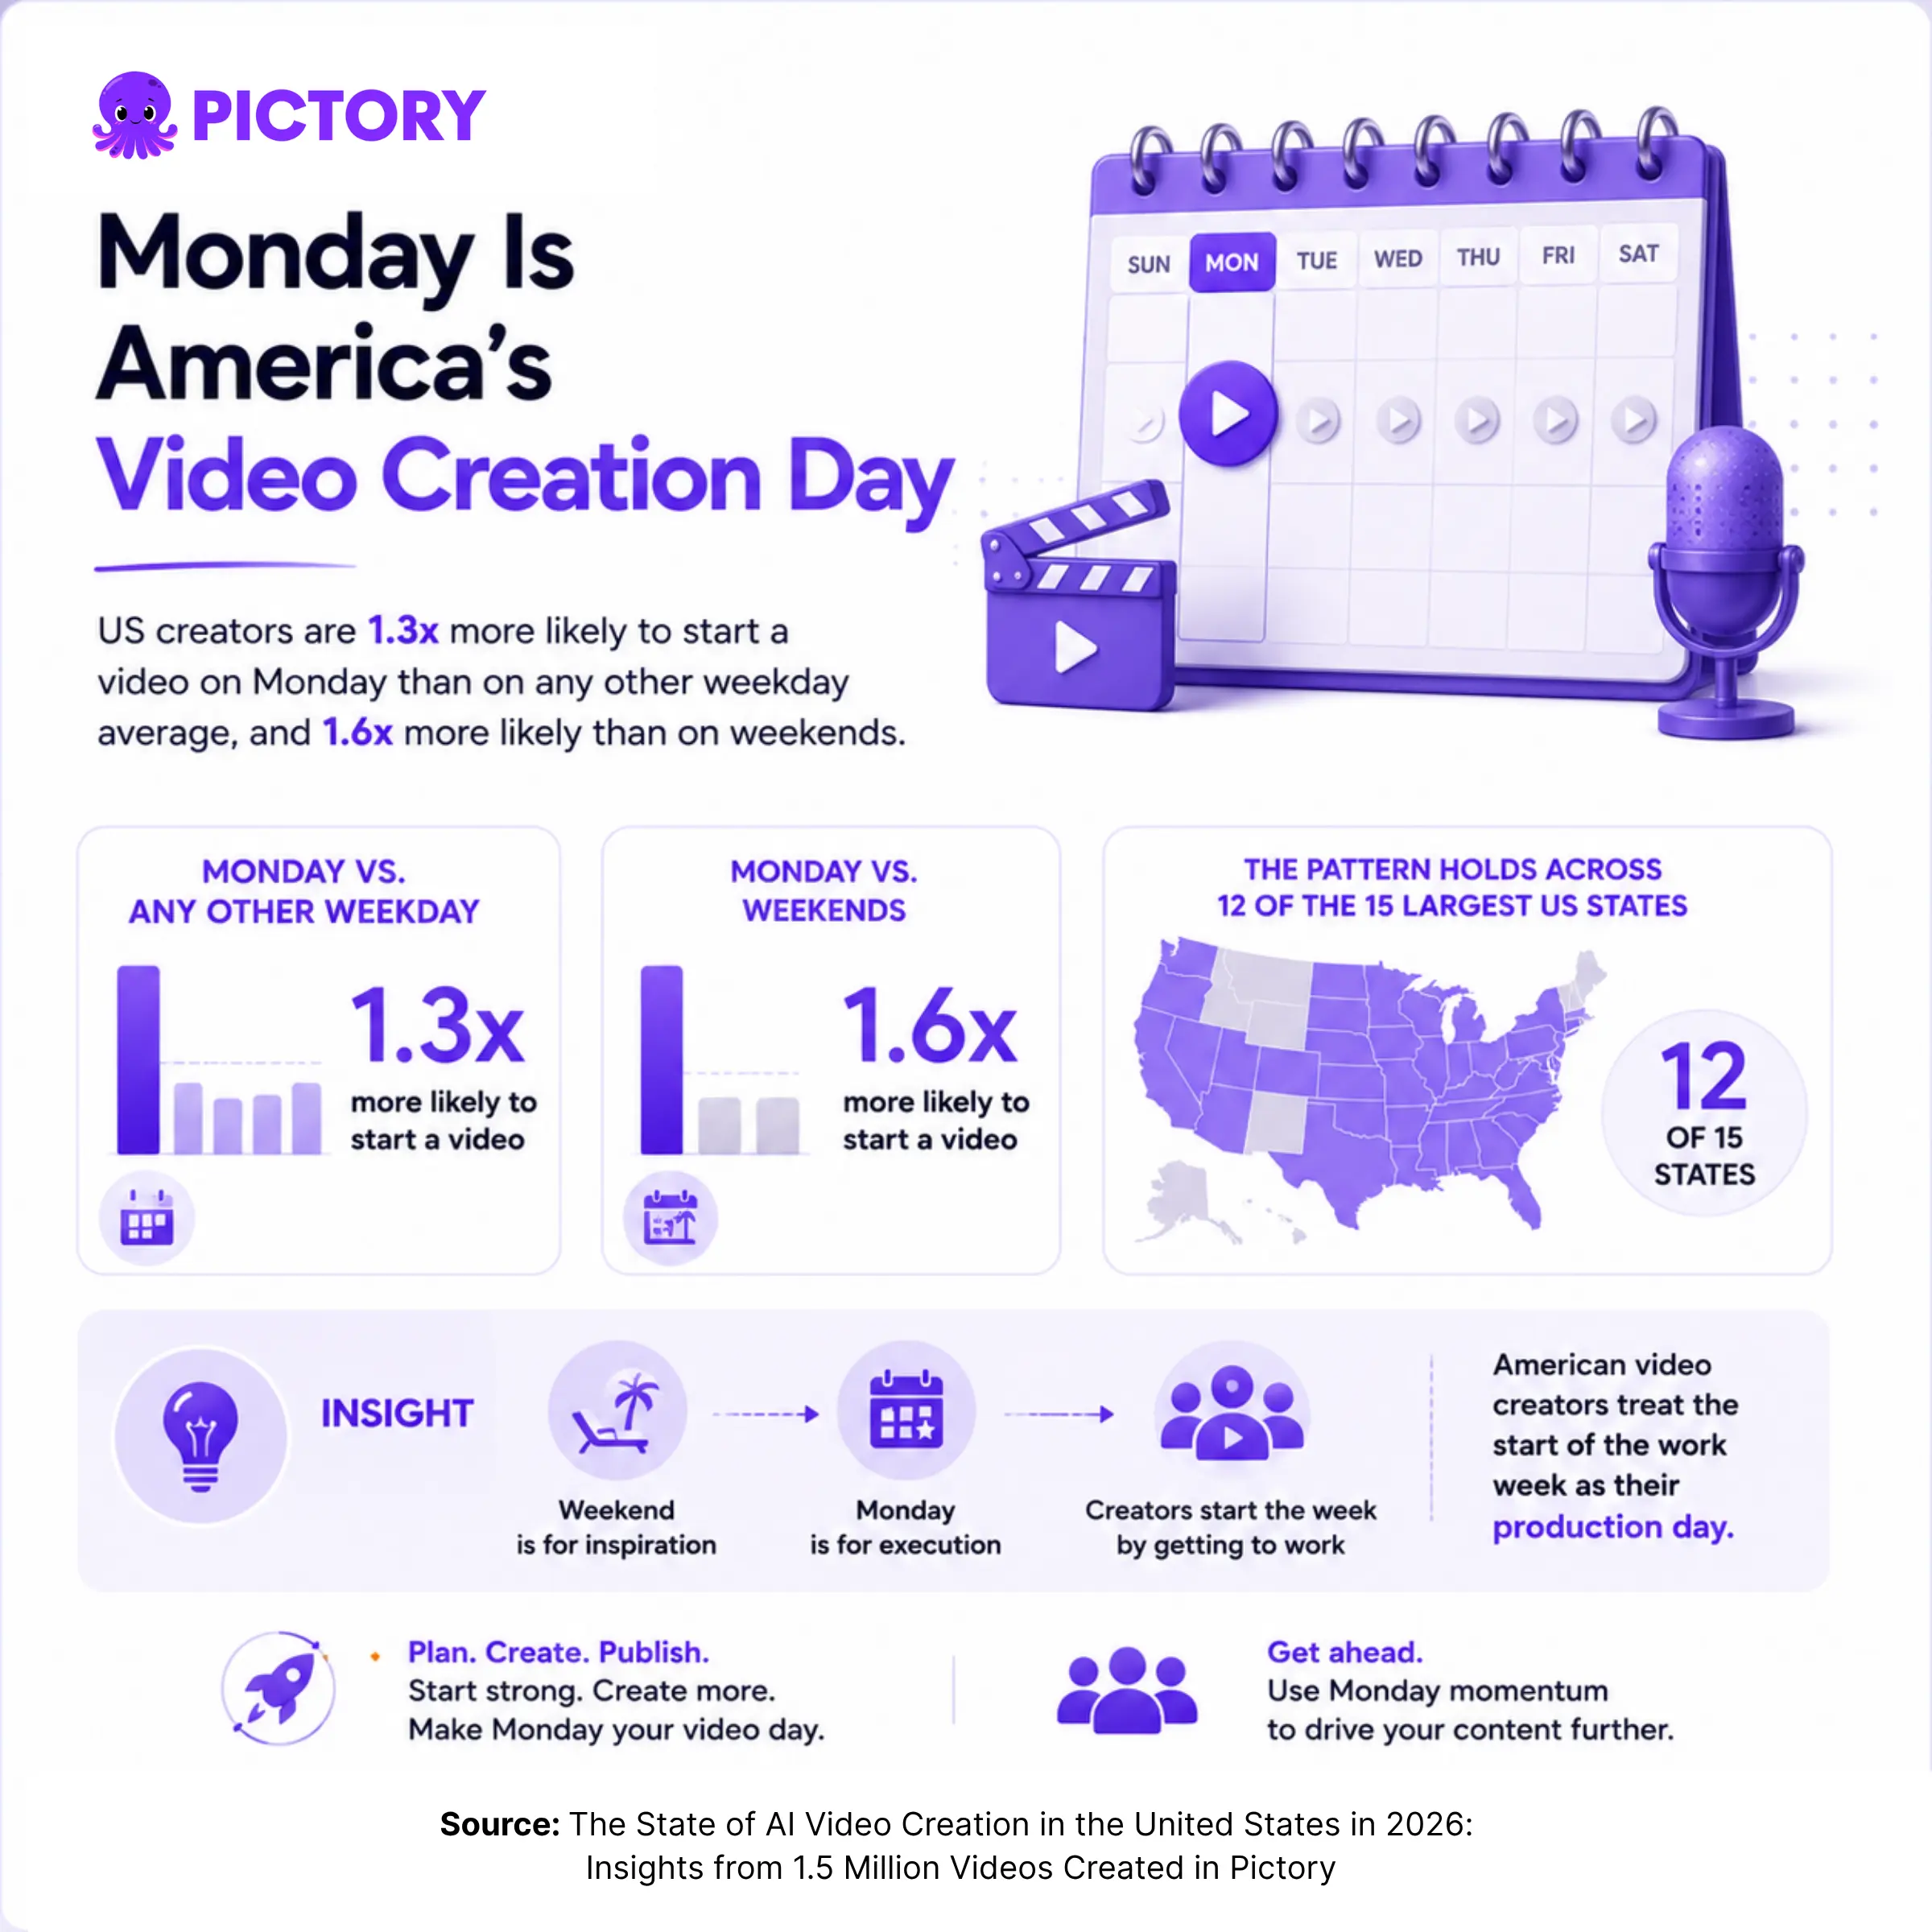
- Monday is the peak creation day in 12 of the 15 largest states
Every figure here is normalized per user, not per state. California still makes the most videos in raw terms because it has the most creators. The per-user rate answers a different question: how hard the average creator in a state leans on a given feature. That comparison is the one that transfers to your own team.
Which state creates the most AI videos per person?
Virginia. Virginia creators start video generation at 2.2x the per-user rate of California and 5.5x the US average, the highest of any large state. Texas comes second at 3.8x the national average. That puts the Mid-Atlantic and the South ahead of the coasts on output per creator.
This isn’t only a Pictory pattern. Virginia also ranks first in the country for ChatGPT messages per person per day, which points to heavy AI use across the state rather than a quirk of our user base.
Virginia also makes the shortest videos of any major state, at 77% of the national average duration. High frequency and short runtime tend to travel together. Proximity to federal agencies and tech employers, where fast-turnaround content is routine, is a plausible reason. We can see the behavior in the data but not the cause, so treat that as a reading rather than a finding.
There’s something here even if you’re nowhere near Virginia. When a competitor publishes five times more video than you, copying their volume rarely works. Copying their format usually does, because short repeatable script to video output holds presence better than occasional long-form.
Oregon Is America’s AI Image Generation Capital
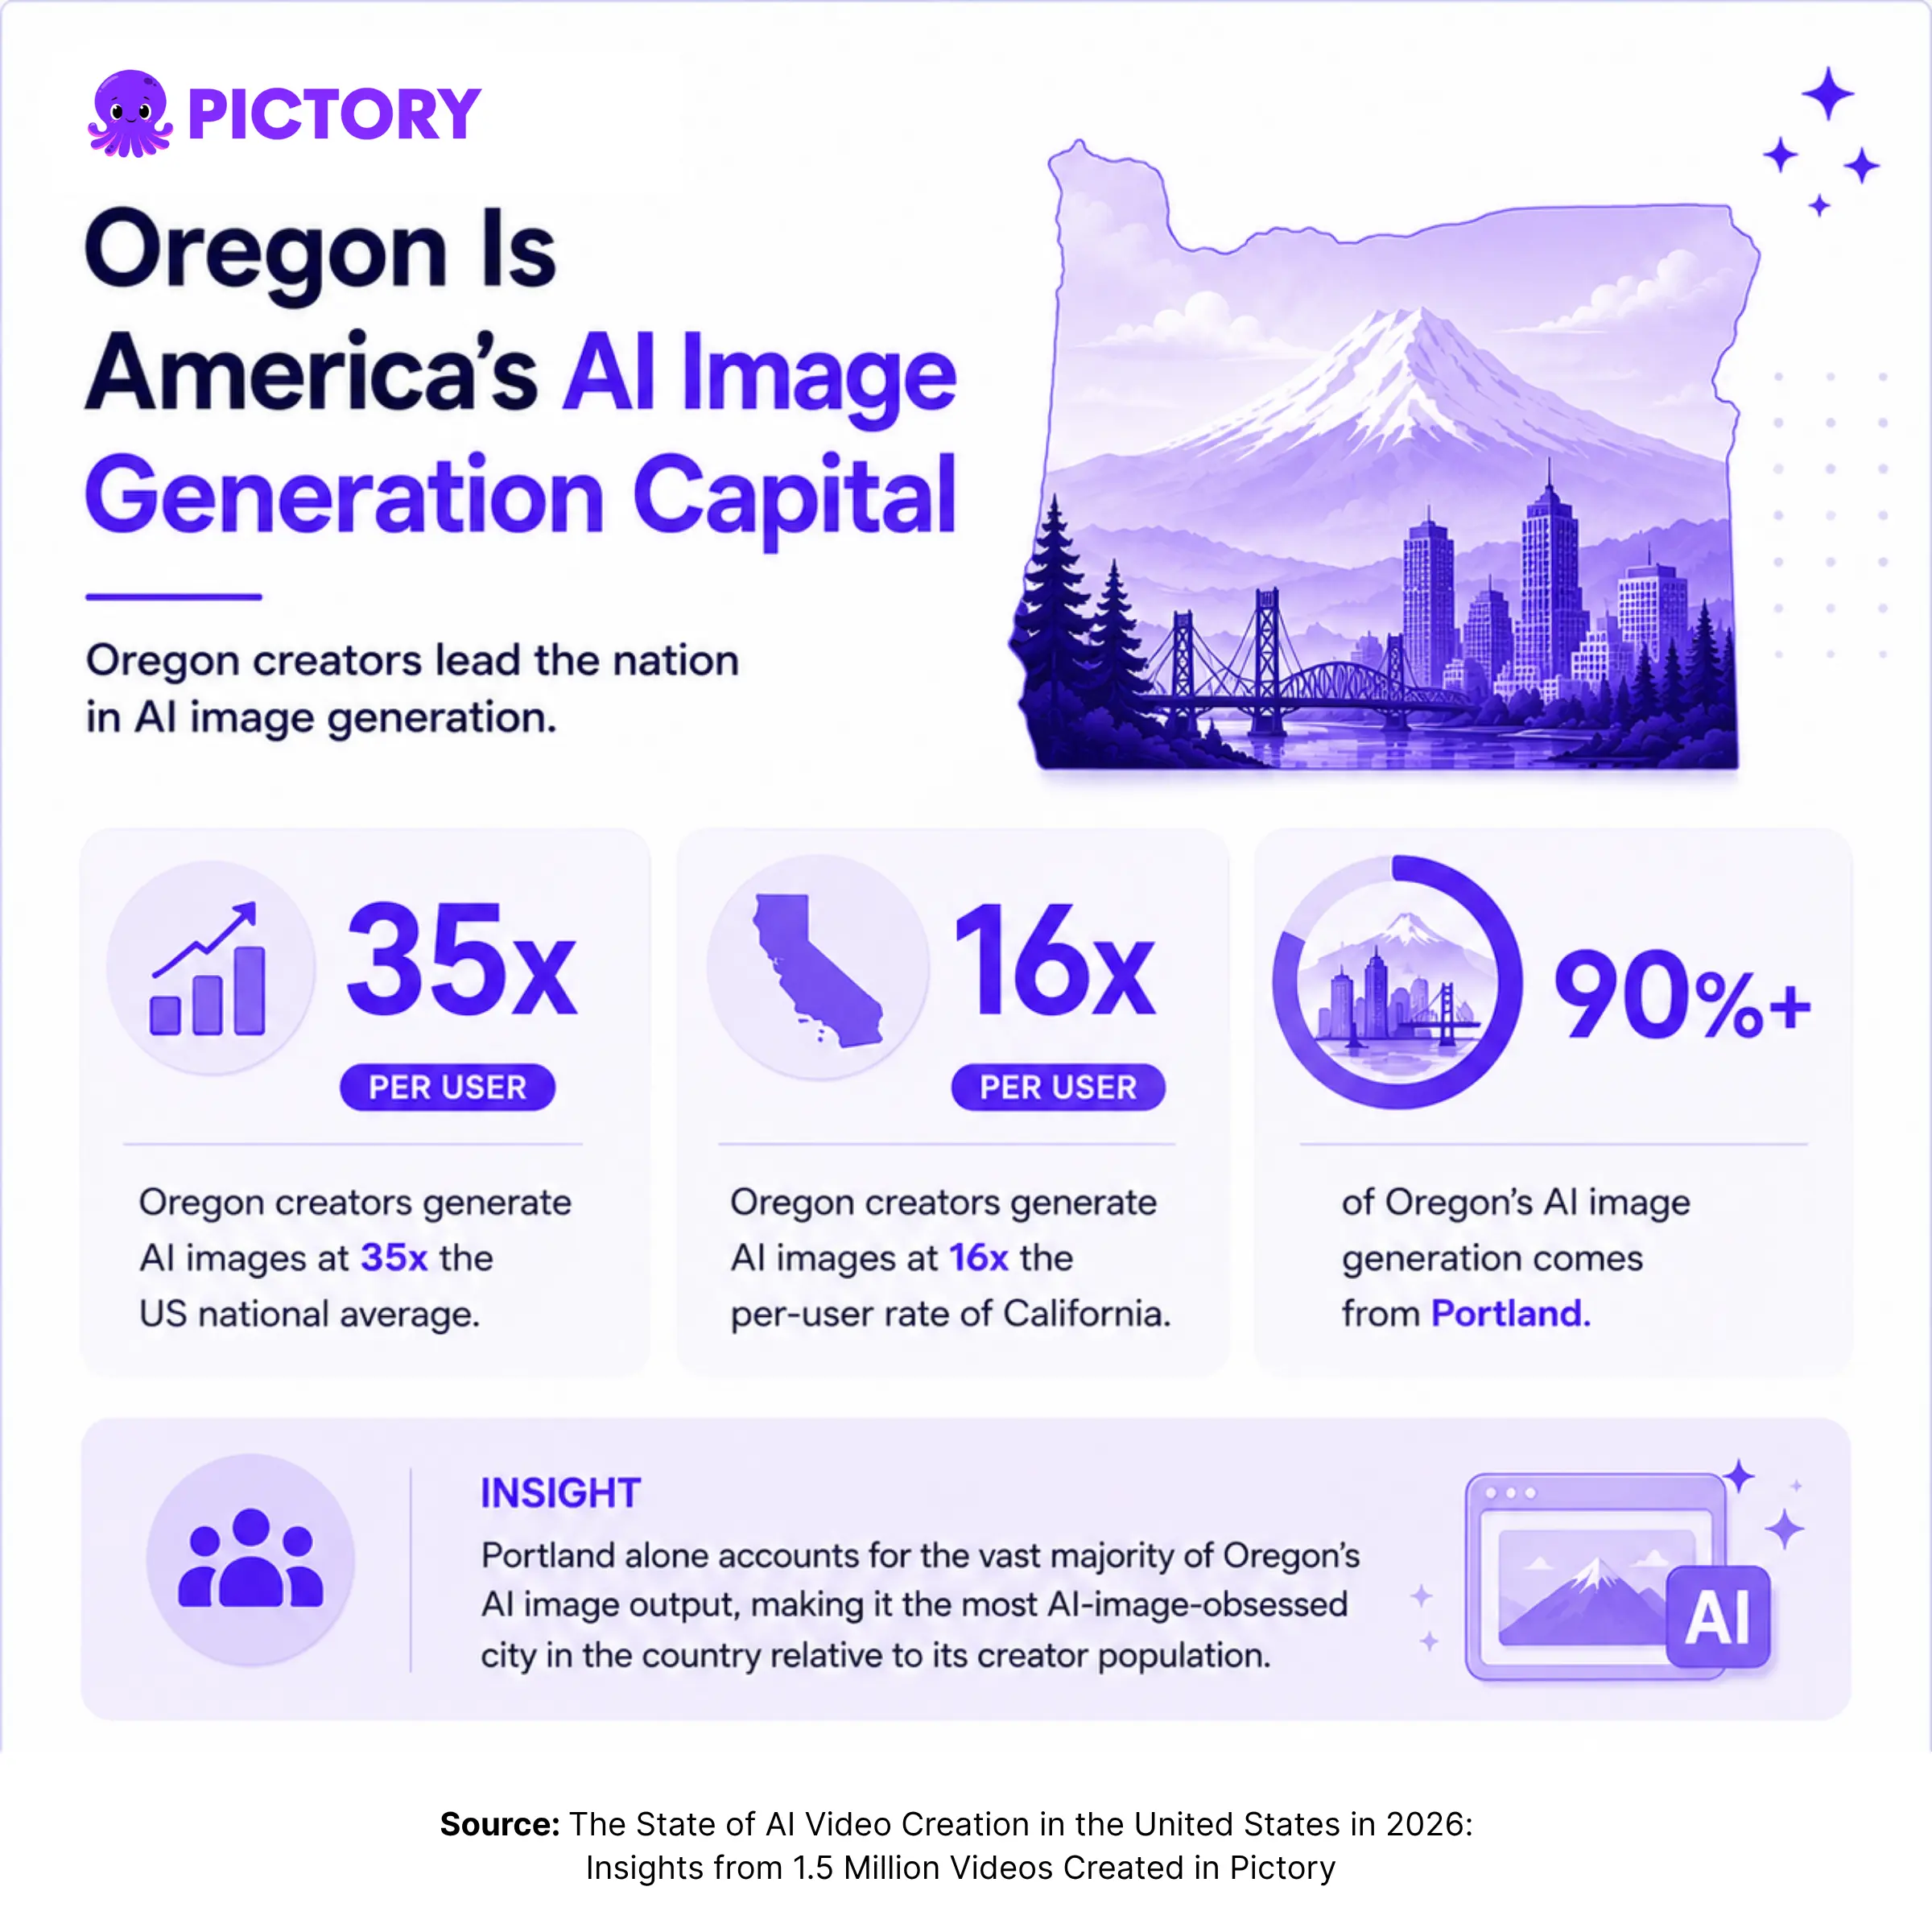
Oregon creators generate AI images at 35x the US national average per user, and at 16x the per-user rate of California. Portland accounts for the vast majority of that output, which makes it the most AI-image-focused city in the country relative to its creator population.
Oregon creators generate AI images at 35x the US national average per user, and 16x the rate of California. Source: 2026 State of Video Report
Oregon’s lead isn’t an accident of our user base either. The state ranks fourth nationally for business AI adoption at 21.1%, while California sits 13th at 19.5%. Oregon picks up AI tooling early across the board, and image generation is where that shows up hardest inside video work.
It’s still the widest single-feature gap in the whole US dataset. Oregon’s design community and tech-forward culture are the obvious candidates for why, though the data shows the pattern and not the reason.
Creators generating images at that rate have stopped searching stock libraries for a shot that almost works. They describe the shot instead. If you’ve ever spent 20 minutes hunting for a visual that half-matches your script, that’s the step they removed. You can generate visuals from a text prompt inside the editor and drop them into a scene.
Which states rely most on voiceovers and AI avatars?
Pennsylvania leads on both. Its creators upload custom voiceovers at 8.9x the US average per user and apply AI avatars at 6.9x. Alabama follows at 7.5x for voiceovers, Georgia at 7x, and Washington state at 5.2x. Washington ranks second for avatars at 3x.
The city data is sharper than the state data. Buffalo uploads voiceovers at 2.7x the rate of New York City, despite being a fraction of its size. Across the South and Mid-Atlantic, Florida, Georgia, and Tennessee creators apply AI avatars at 3.5x the US average.
Both features do the same job. A recognizable voice or a consistent presenter tells the viewer that a person stands behind the content, which stock footage can’t do. For training video and anything instructional, that counts for more than production value.
You can add an AI voiceover so every video sounds the same, or use an AI avatar generator to put a consistent presenter on screen without filming. Either one removes the recording step that usually stops people publishing.
A caveat on Alabama: its creator base is smaller than Pennsylvania’s, so read that 7.5x as directional rather than settled.
Video Length Is a Regional Habit
Minnesota creators produce videos 2.2x longer than the US national average, 2.5x longer than California creators, and 2.9x longer than Virginia creators. Michigan and New York also skew long, at 1.4x and 1.3x the national average. Virginia sits at the other end, at 77%.
North Carolina goes a third way. Its creators adjust scene duration at 5.6x the US average per user, 1.6x the rate of California, and 2.2x the rate of Virginia. They aren’t making the longest videos, they’re spending the most time on where each scene starts and stops.
That spread matters because there’s no national consensus on length, which means there’s no rule you’re breaking. Length should follow the job the video does. A product walkthrough earns three minutes. A social teaser doesn’t earn 30 seconds unless the first three are strong.
Why is Monday America’s video creation day?
US creators are 1.3x more likely to start a video on Monday than on the average weekday, and 1.6x more likely than on a weekend. The pattern holds in 12 of the 15 largest states. Americans treat the start of the work week as production day.
Those 12 states are Texas, Virginia, New York, Illinois, Georgia, Washington, New Jersey, Arizona, Ohio, Pennsylvania, Indiana, and Massachusetts. Three break the pattern. North Carolina peaks on Tuesday, the only consistent Tuesday state in the dataset. California splits its peak between Thursday and Friday, the one large state that doesn’t front-load. Florida peaks on Friday, wrapping the week rather than starting it.
Not a single state in the top 15 peaks on Saturday or Sunday. Across America, video production is a weekday job that people keep separate from their own time.
Do marketers, YouTubers, and business owners create video differently?
The split is sharp, and it runs along geography more than job title. California YouTubers add background music at 1.7x the US YouTube average, the highest of any state. Texas YouTubers add it at 27% below that average. A California YouTuber is 2.3x more likely to reach for a soundtrack than a Texas one.
Voiceover splits along the same line, in the opposite direction. YouTube creators in Virginia, Washington, New Jersey, Illinois, and Pennsylvania upload voiceovers at 1.8x to 1.9x the US YouTube average. California YouTubers sit at 0.8x. A Virginia YouTuber is 2.4x more likely to add a voiceover than a California one.
The business-owner data surprised us most. Georgia business owners use text to video at 1.3x the US business-owner average, the highest of any state, and 1.5x the rate of California business owners. California business owners run 17% below the national business-owner average, the lowest of any major state.
So the largest state by creator volume has the slowest per-creator adoption of automated video among its business owners. Existing in-house creative teams are one plausible reason. Either way, leading on volume and leading on workflow are clearly different things.
What These Trends Mean for Your Video Strategy
Four of these patterns transfer regardless of where you sit.
Batch production on Monday
Creators front-load the week because Monday is when they have the headspace. If you publish Tuesday through Thursday, that makes Monday your real bottleneck. Block it out, script in bulk, and generate your first drafts in one sitting.
Treat voiceover as a recognition tool
The voiceover-heavy states are building familiarity with their audiences. One consistent voice across every video does more for recall than better b-roll. Pick one and stay with it.
Generate visuals instead of searching for them
Describing the visual you need takes less time than filtering a stock library, and the result matches your script instead of approximating it. That accounts for most of Oregon’s 35x advantage.
Pick length by intent, not by habit
Minnesota goes long, Virginia goes short, and both work for their creators. Decide what the video has to accomplish, then set the runtime around that.
Put the data to work this week
Turn a script, a URL, or a slide deck into a finished video with captions, voiceover, and your branding applied. Fast, scalable, affordable.
Methodology
Pictory analyzed aggregated, anonymized behavioral data from more than 1.5 million videos created on its platform in 2026. US creators account for 22% of the dataset.
The data covers workflow types (text to video, URL to video, audio to video, PPT to video), feature usage including AI avatars, voiceovers, background music, and AI image generation, plus creator segments and device types. All metrics are calculated per user, so states can be compared regardless of creator population. When a finding says a state runs at “5.5x the US average,” that means the per-user rate in that state divided by the per-user rate nationally.
Two limits are worth naming. States with smaller creator bases, Alabama among them, are directional rather than settled, and we’ve flagged those in the text. And this is platform data rather than a census. It shows how Pictory creators behave, which skews toward marketing, education, and small business teams rather than film production.
CITATION POLICY
These findings are free to cite. Please credit Pictory and link to pictory.ai/blog/ai-video-creation-trends-state. For the global cut, including regional data outside the US, see the full 2026 State of Video Report.
The Verdict
This data is most useful if you’re a marketer or content lead producing video without a dedicated video team. You get benchmarks drawn from what people did 1.5 million times, rather than from what they told a survey they intend to do. If you’re weighing whether to add voiceover, generate visuals, or restructure your production week, that’s a better guide than another best-practices post.
The limits are real. This is single-platform data, so it reflects how Pictory creators work rather than the whole US market. Creators here skew toward marketing teams, educators, and small business owners. The regional explanations we’ve offered are interpretations, not measured causes. States with smaller creator bases also carry wider error than the large ones.
The recommendation: pick one pattern and test it this month. Batch your production on Monday, or set a single voiceover across your next 10 videos, and measure what changes. If you need to run video at scale across markets or products, the Pictory API generates video programmatically inside your existing systems.
Start your first video in minutes
No editing skills, no software to install, no camera required.
FAQ: AI Video Creation Trends by State
Which US state creates the most AI videos per person?
Virginia. Virginia creators start video generation at 2.2x the per-user rate of California and 5.5x the US average, the highest of any large state. Texas comes second at 3.8x the national average. Population size doesn’t predict output, so per-user rates tell a different story than raw volume.
What day of the week do most people create videos?
Monday, by a clear margin. US creators are 1.3x more likely to start a video on Monday than on the average weekday, and 1.6x more likely than on a weekend. The pattern holds in 12 of the 15 largest states. No state in the top 15 peaks on Saturday or Sunday.
Which states use AI avatars the most?
Pennsylvania leads at 6.9x the US average per user, followed by Washington state at 3x. Florida, Georgia, and Tennessee creators apply avatars at 3.5x the national average. That makes the South and Mid-Atlantic the two dominant avatar-using regions in the country.
Do California creators lead AI video adoption?
Not per creator. California business owners use text to video 17% below the national business-owner average, and California is the only large state that doesn’t peak on Monday. It leads on total volume because of its size, but smaller states outpace it per person.
How was this AI video data collected?
Pictory analyzed aggregated, anonymized behavioral data from more than 1.5 million videos created on its platform in 2026. US creators account for 22% of the dataset. Metrics are normalized per user so states can be compared regardless of population. It’s product usage data, not survey responses.
Related Reading
50+ market, adoption, and ROI numbers for your next business case.
Put a consistent presenter on screen without a camera.
The full global cut of the 1.5 million video dataset.

![[Blog] - Training Video Cost & ROI: What It Actually Costs to Build a Program in 2026](https://pictory.ai/wp-content/uploads/2026/07/blog-training-video-cost-roi-2026-300x169.webp)